Agroclimatic atlas of Canada

Accompanying maps

Potential evapotranspiration

Figure 1.1 Annual potential evapotranspiration (50% probability)

Download a larger version of the map (zipped JPEG, 11.7 MB)

Figure 1.2 Seasonal evapotranspiration (50% probability)

Download a larger version of the map (zipped JPEG, 10.5 MB)

Seasonal water deficits

Figure 1.3 100 mm storage (50% probability)

Download a larger version of the map (zipped JPEG, 10.2 MB)

Figure 1.4 100 mm storage (10% probability)

Download a larger version of the map (zipped JPEG, 11.1 MB)

Figure 1.5 25 mm storage (50% probability)

Download a larger version of the map (zipped JPEG, 12.25 MB)

Figure 1.6 25 mm storage (10% probability)

Download a larger version of the map (zipped JPEG, 12.0 MB)

Climatic moisture indices

Figure 1.7 Climatic moisture indices

Download a larger version of the map (zipped JPEG, 11.9 MB)

Spring freeze dates

Figure 2.1 Average dates of last spring (freeze of 0°C)

Download a larger version of the map (zipped JPEG, 9.4 MB)

Figure 2.4 Dates of last spring freeze (0°C, 10% probability)

Download a larger version of the map (zipped JPEG, 10.2 MB)

Figure 2.6 Average dates of last spring freeze (-2°C)

Download a larger version of the map (zipped JPEG, 10.6 MB)

Figure 2.9 Dates of last spring freeze (-2°C, 10% probability)

Download a larger version of the map (zipped JPEG, 10.9 MB)

Fall freeze dates

Figure 2.2 Average dates of first fall freeze (0°C)

Download a larger version of the map (zipped JPEG, 10.7 MB)

Figure 2.5 Dates of first fall freeze (0°C, 10% probability)

Download a larger version of the map (zipped JPEG, 9.9 MB)

Figure 2.7 Average dates of first fall freeze (-2°C)

Download a larger version of the map (zipped JPEG, 11.8 MB)

Figure 2.10 Dates of first fall freeze (-2°C, 10% probability)

Download a larger version of the map (zipped JPEG, 10.7MB)

Freeze-free dates

Figure 2.3 Average freeze-free period (0°C base)

Download a larger version of the map (zipped JPEG, 9.9 MB)

Figure 2.8 Average freeze-free period (-2°C base)

Download a larger version of the map (zipped JPEG, 11.7 MB)

Soil water reserves in the prairie provinces

Figure 3.1 Reserves for spring wheat for May 1st planting on summerfallow

Download a larger version of the map (zipped JPEG, 13.6 MB)

Figure 3.2 Reserves for spring wheat for May 20th planting on summerfallow

Download a larger version of the map (zipped JPEG, 15.4 MB)

Figure 3.3 Reserves on October 1st after spring wheat seeded on May 1st

Download a larger version of the map (zipped JPEG, 18.4 MB)

Figure 3.4 Reserves on October 1st after spring wheat seeded on May 20

Download a larger version of the map (zipped JPEG, 17.8 MB)

Figure 3.5 Reserves on May 1st for the summerfallow year

Download a larger version of the map (zipped JPEG, 18.8 MB)

Figure 3.6 Reserves on October 1st for the summerfallow year

Download a larger version of the map (zipped JPEG, 18.6 MB)

Figure 3.7 Water deficits (50% probability)

Download a larger version of the map (zipped JPEG, 12.9 MB)

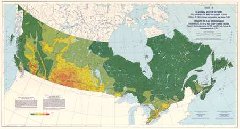
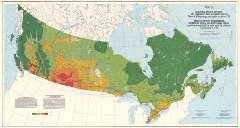
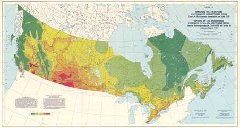
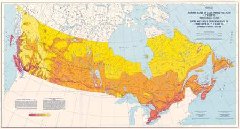
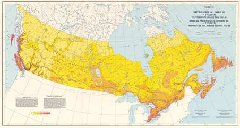
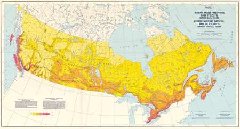
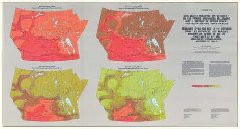
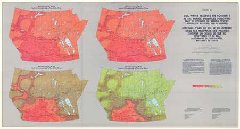
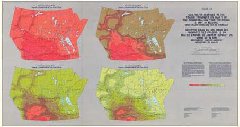
Mean soil temperatures

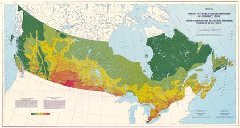
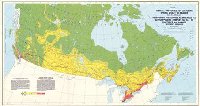
Figure 4.1 Mean annual soil temperatures at 10 cm

Download a larger version of the map (zipped JPEG, 10.8 MB)

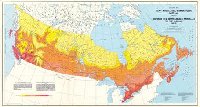
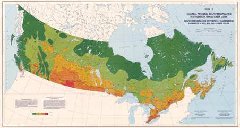
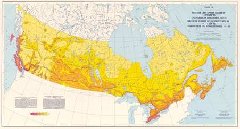
Figure 4.2 Mean annual soil temperatures at 20 cm

Download a larger version of the map (zipped JPEG, 11.6 MB)

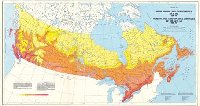
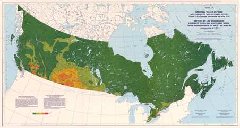
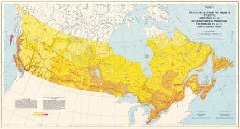
Figure 4.3 Mean annual soil temperatures at 50 cm

Download a larger version of the map (zipped JPEG, 11.6 MB)

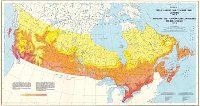
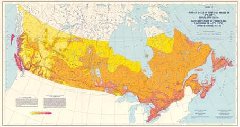
Figure 4.4 Mean summer soil temperatures at 10 cm

Download a larger version of the map (zipped JPEG, 11.1 MB)

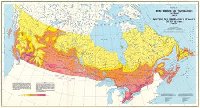
Figure 4.5 Mean summer soil temperatures at 20 cm

Download a larger version of the map (zipped JPEG, 11.7 MB)

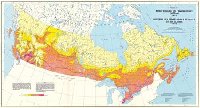
Figure 4.6 Mean summer soil temperatures at 50 cm

Download a larger version of the map (zipped JPEG, 11.4 MB)

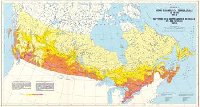
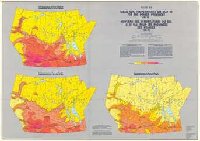
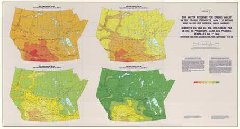
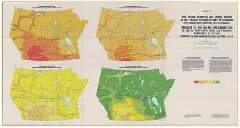
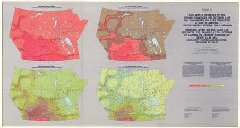
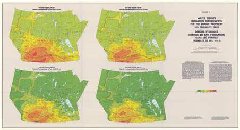
Figure 4.7 Mean temperatures on May 1st for the prairie provinces

Download a larger version of the map (zipped JPEG, 10.9 MB)

Figure 4.8 Mean temperatures on May 20th for the prairie provinces

Download a larger version of the map (zipped JPEG, 13.2 MB)

Thermal resources for maturing crops

Figure 5.1 Spring wheat

Download a larger version of the map (zipped JPEG, 13.6 MB)

Figure 5.2 Barley

Download a larger version of the map (zipped JPEG, 12.4 MB)

Date modified: